All Activity
- Today
-
 Alberto joined the community
 - Last week
-
 Sophie CDT joined the community
 -
Hi Michele, Thanks for letting us know. We have rolled out an update to the service, which has improved download speeds, but seems to have issues with larger requests. We are currently investigating the issue, but haven't found a solution yet. For now the best option is to download smaller subsets of data as you mention you are already doing. Sorry for the inconvenience.
-
Hello, I am trying to download wind speed & direction time-series but I have been experiencing a "Bad Gateway" error since last week. For reference, this is the API link I am using: https://wps.neweuropeanwindatlas.eu/api/mesoscale-ts/v1/get-data-point?latitude=37.6056&longitude=12.0235&height=100&height=75&height=150&height=200&height=250&height=50&height=500&variable=WD&variable=T&variable=WS&dt_start=1989-01-01T00:00:00&dt_stop=2022-12-31T23:30:00 I can only download smaller subsets of data e.g., 1 year. Is anybody else experiencing the same issue? Many thanks, and Regards Michele
-
 Michele Martini joined the community
 - Earlier
-
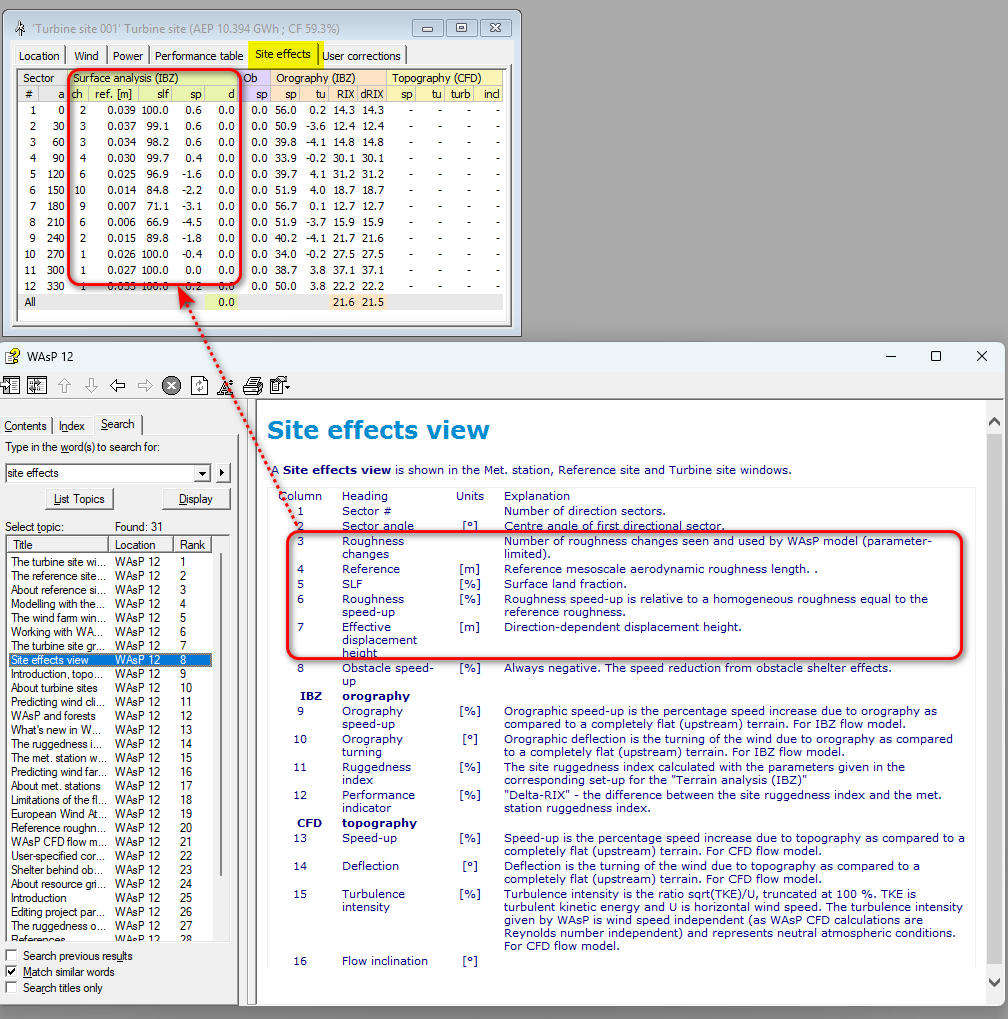
The roughness rose will cover the same area as the user-supplied map out to a radial distance of 30 km. It replaces the detailed roughness patterns of the real map. The European Wind Atlas explains how the roughness values in the sector segments are calculated. As you learnt in the WAsP course, the provided map must include a margin around any site of interest equal to 100-150 times the hub or anemometer height. For each sector, the flow model assumes a wind profile based on the far-upwind reference surface roughness, and this basic profile is corrected by internal boundary layers. You can see this in the site view>site effects view. The roughness rose is still used inside the model, but the developers choosed to remove it from the WAsP 12 user interface. I sometimes miss it for pedagogical reasons.

-
Correct, all turbines' wake model parameters are uniform, but you can modify wake-decay parameters for individual sectors.
-
to make more clear for question 1, which values do WAsP take from 3km to 30km if values from roughness lengths cannot be considered? , e.g. zero roughness value or last roughness value observed at 3km or something else?
-
Dear Morten, Thanks for your confirmation. it means that the WAsP wake model applies for the entire wind farm with the same values and no chances to separate the wake parameters for turbine groups. Thanks for screen dump and detailed explanations. as you pointed out, that was the my concerns "the terrain is complex and elevation difference is higher even though RIX numbers are not high". Regars, Gyeongil
-
Dear Morten, Thanks for your confirmation and answers. if "10 different roughness changes were observed by WAsP in short distances (let's say in 3km), WAsP did not consider roughness changes any further in distances" is true, then (Question 1) what is the impact on AEP if further distance roughness changes are not considered (e.g. from 3km up to 30km)? when I was in WAsP course in DTU, i have learned that most critical information of roughness chances is border (100 ~ 150 x Hub heights) as this affects in transition boundary layer. in this case it seems WAsP did not correctly consider. (Question 2) to my understanding roughness rose is not anymore valid since WAsP 11.x and later version. Does WAsP 12.x use now again roughness rose? Could you clarify two additional questions? Regards, Gyeongil
-
Your colleague is right. WAsP simplifies the detailed surface roughness map to a local polar map around each site of interest. We sometimes call this simplified map a roughness rose, and it has common roughness values within each sector and fewer roughness changes in the radial direction. The original roughness-simplification method is described in chapter 5 of European Wind Atlas - DTU Findit around page 81. The method may have been updated later, but the principle is the same. The maximum radius of the roughness rose is something like 30 km. We recommend that the map prepared by QGIS has a margin around any site of interest equal to 100-150 times the hub height or anemometer height.
-
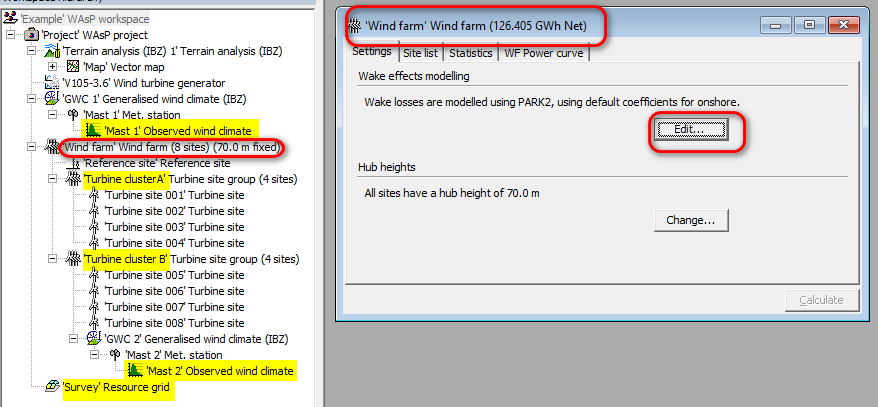
Hi Gil, The WAsP wake model applies global parameters for the entire wind farm. Right-click the main turbine site group and click the 'Edit' button to modify them. You can use the observed wind climates for two masts if you arrange the WAsP project as in the attached screen dump. Here, I inserted two nested turbine groups as child objects to the wind farm and sorted the turbine sites for their most representative met mast. I inserted two wind climates, one for each mast, and attached the second wind climate to the second sub-group. In the screen dump, Turbine cluster A is modelled by Mast 1 while Turbine cluster B is modelled by Mast 2. The WAsP flow model may not cross-predict from one met-mast to another correctly, especially if the terrain is complex and RIX numbers differ. Furthermore, be aware of the risk of mistaking annual wind climate variations for spatial variations if the measurement periods of the two met masts differ. Regards, Morten
-
Dear Team, based on old knowledge and after discussion with a colleague, i am a bit confused about how WAsP handles many roughness changes in short distances. from a colleague, she mentioned if 10 different roughness changes were observed by WAsP in short distances (let's say in 3km), WAsP did not consider roughness changes any further in distances (in this case from 3km up to 20km - typical map size and boundary). is this true? Based on recent improvement and implementation of QGIS instead of Map editor, the user can digitize more detailed roughness. if the above is applied, then i am wondering the impact. could you explain me and advise me how WAsP handles many roughness changes in short distances? regards, Gyeongil
-
Dear Team, I have two masts at the site and more than 20 wind turbines are planned. during test simulation i found out wake calculations by two different masts are quite different and in the end energy level differences are also high. i have not used default settings of wake settings in PARK2 but try to adjust and simulate. one parts of turbine groups are close to mast 1 and another groups are close to mast 2. the elevation difference between mast 1 and 2 are almost 200m asl. that is why I considered it makes more sense to separate two groups. however, all wind turbines should be considered as a whole. Are there any way to calculate wakes by applying different wake parameters in a wind farm? i am thinking to make the results separately and merge together. but in this case, i should consider again the wake by each group. it would be great if you could advise me how to apply in WAsP. regards, Gyeongil
-

Serveral Errors Responses 502 / 504 / 404
PascalT replied to PascalT's topic in New European Wind Atlas
Hi Neil, thanks for your reply and the explanation, I will try again in a few days. Best, Pascal -

Serveral Errors Responses 502 / 504 / 404
Neil Davis replied to PascalT's topic in New European Wind Atlas
Hi Pascal, We rolled out a new backend on a new server Monday evening (23.02.2025). We have noticed some instability, we have diagnosed it to be related to some memory issues on the new server. We hope to have a fix either today or tomorrow. Best, Neil -
Dear Team, i am doing resource assessments in forest site with multi-masts mainly based on WAsP. Western and southern parts of the site have a steep slope > 16.7 degree, so that I ordered WAsP-CFD. i read most of forest issues in this forum and also from webpage: https://www.wasp.dk/software/wasp-cfd/flow-model to understand better of WAsP-CFD. However I still did not fully understand. I have some questions below. (Question 1) Are there any benefit of WAsP-CFD focusing on forest area? based on webpage above, it seems to me that WAsP-CFD use/interpret roughness data differently. (Question 2) if WAsP-CFD has zero benefit compared to WAsP in terms of forest, should I apply same displacement heights in WAsP-CFD that were applied to WAsP? (Question 3) based on WAsP, three main inputs are oro + rou + obs. How are obstacles dealt with in WAsP-CFD if they are not a part of input before run? My last WAsP course was long time ago and i have used 3rd party CFD tools to handle forest. i think that could be the reason why I am still confused to understand how WAsP-CFD works. Could you please advise/guide me with details? Thanks Gyeongil
-
Hello, since yesterday (24.02.2025), I am experiencing a variety of error responses from the server when requesting data with the URL. The error response is most prominently 502, but also 504 and 404 for the same URL request at different times. Overall, the error response seems to be inconsistent. As anyone else experiencing this issue? -Pascal
-
PascalT joined the community
-
Hi Rogier, Current menu shows the following: WASA Wind Atlas downloads --> WASA Observational Wind Atlas UPDATED (Dec 2018) : The WASA observational wind atlas contains observed (OWC) and generalized (GWC) wind atlas data sets for the 15 meteorological stations established and operated by the WASA project. Observed wind climate files from the 15 WASA stations. The data mostly cover an eight year period from November 2010 to September 2018 for the WASA 1 masts and a three-year period from November 2015 to October 2018 for the WASA 2 masts. The WAsP workspace WASA 1+2 validation 2018.wwh contains data and sample maps for the 15 meteorological stations in the Wind Atlas for South Africa. then they are linked to: Observed wind climate (OWC) Generalised wind climates (GWC) WAsP analysis of WASA stations (WWH) if you have those files, it would be great but if not, I think I need to download all data and process by myself. Thanks. Gyeongil
-
No these data have unfortunately "passed away" with our file server being closed. Which specific files do you need? We might still have them but it will be a manual process.
-
PyWAsP 0.7.0 and Windkit 0.8.0 released
Neil Davis replied to Neil Davis's topic in Release Announcements
The Windows packages of PyWAsP 0.7 have been uploaded to our conda channel. -
Dear team, i am trying to use WAsP for south African projects and found out many data is already available from webpage: https://wasadata.csir.co.za/. in the section "WASA Observational Wind Atlas" there are links to DTU servers but it seems not working anymore. // The following files are not yet available on the local server, but can be downloaded from the DTU server Observed wind climate (OWC) Generalised wind climates (GWC) WAsP analysis of WASA stations (WWH) // Are those data still available from DTU server? if yes, could you please provide me the new/updated links? if not, are there any way to download those data sets? please advise me. BR, Gyeongil
-
 Gil joined the community
 -
Dear Cindy, Have you tried downloading the latest available version of the software? If the issue persists, you might consider confidentially sharing your project with WAsP Support. This would help determine whether the problem originates from the project itself or is related to another issue. Thanks and best regards, Joan
-
so i will run my modeling, after i press execute suddenly exit from the software. i do it repeatedly and still the result is like that.
-
 cindy elga joined the community
 -
 Camilo joined the community
 -
Thanks Rogier, that resolves the issue.
-
The coordinates from the original WRF projection are already stored in the west_east and south_north coordinates and the spatial reference is already stored in the crs variable. So to make a tif you can do: import xarray as xr ds = xr.open_dataset("mesoscale-ts.nc") ds_proj_mean = ds.WS.mean("time") ds_proj_mean.rename({"crs":"spatial_ref"}).rio.to_raster("ws_150.tif") That opens it in the right place for me: or to get it in 2157: ds_proj_mean = ds.WS.mean("time") ds_proj_mean = ds_proj_mean.rename({"crs":"spatial_ref"}).drop_vars(["XLAT","XLON"]).rio.reproject("EPSG:2157") ds_proj_mean.rio.to_raster("ws_150_2157.tif")
-

WAsP 12.9 updates - T* stability, geostrophic shear and others
Reuven Shenkar replied to Reuven Shenkar's topic in WAsP
Many thanks, Rogier! -
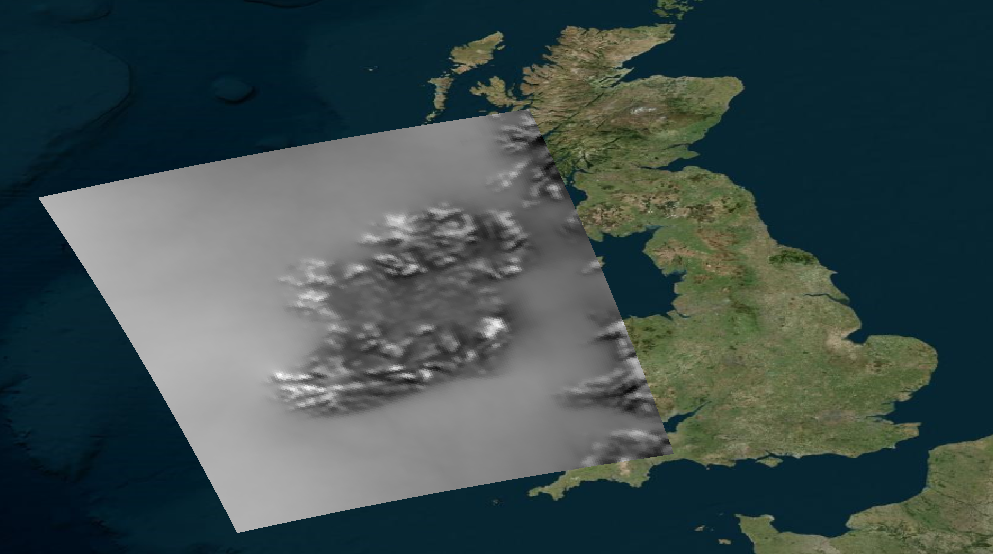
I am new to working with .nc files. I want to calculate the annual electricity production (AEP) for offshore wind turbines around Ireland based on the spatially resolved wind speed time series data from the New European Wind Atlas. However, I encounter the problem that my resulting AEP is not located correctly after I imported it into QGIS for post-processing. Here are my working steps without aiming for a correct projection and placement : 1. I download the wind data for each month in 2018 (here displayed the URLs for January and December 2018): https://wps.neweuropeanwindatlas.eu/api/mesoscale-ts/v1/get-data-bbox?southBoundLatitude=50.5&northBoundLatitude=56.1&westBoundLongitude=-11.6&eastBoundLongitude=-5.2&height=150&variable=WS&dt_start=2018-01-01T00:00:00&dt_stop=2018-01-31T23:59:59 ... https://wps.neweuropeanwindatlas.eu/api/mesoscale-ts/v1/get-data-bbox?southBoundLatitude=50.5&northBoundLatitude=56.1&westBoundLongitude=-11.6&eastBoundLongitude=-5.2&height=150&variable=WS&dt_start=2018-12-01T00:00:00&dt_stop=2018-12-31T23:59:59 2. I utilize a Python script with xarray to calculate the AEP with the power curve of a reference turbine: # Imports import xarray as xr import numpy as np import windkit as wk import rasterio import pandas as pd from rasterio.transform import from_origin # Constants rho_air = 1.215 # kg/m³ D_r = 240 # Rotor diameter in meters P_r = 15e6 # Rated power in Watts v_cut_in = 3.0 # m/s v_cut_out = 25.0 # m/s v_rated = 10.59 # m/s A = np.pi * (D_r / 2) ** 2 # m² # Input # Loop through each month's wind speed data files for month in range(1, 13): file_path = f"R:\...\Wind speed time series\\mesoscale-ts-2018-{month:02d}.nc" print(f"Loading wind speed dataset for month {month}...") data = xr.open_dataset(file_path) # Einlesen der Daten als xarray.Dataset print(f"Dataset for month {month} loaded successfully.") # Resample the data to hourly mean data = data.resample(time='h').mean() # Load power curve power_curve_path = r"R:\...\Reference_turbine_2032.csv" print("Loading power curve...") power_curve = pd.read_csv(power_curve_path) print("Power curve loaded successfully.") # Interpolate C_p for the wind speeds wind_speeds = power_curve['Wind [m/s]'].values C_p_values = power_curve['Power Coefficient C_p [-]'].values # Interpolate C_p for each time step and location C_p_interpolated = np.interp(data['WS'].values.flatten(), wind_speeds, C_p_values, left=0, right=0) C_p_interpolated = xr.DataArray(C_p_interpolated.reshape(data['WS'].shape), dims=data['WS'].dims, coords=data['WS'].coords) # Calculate the power output based on wind speed conditions data_cond_1 = xr.where((data['WS'] >= v_cut_in) & (data['WS'] < v_rated), 0.5 * rho_air * A * C_p_interpolated * data['WS']**3, 0) data_cond_2 = xr.where((data['WS'] >= v_rated) & (data['WS'] < v_cut_out), P_r, 0) # Total monthly energy production (MEP) for the month MEP_month = data_cond_1 + data_cond_2 # Save the monthly MEP as a separate variable globals()[f'MEP_{month:02d}'] = MEP_month print(f"Monthly electricity production for month {month} calculated.") # Sum the MEPs over time to get total monthly production MEP_01_total = MEP_01.sum(dim='time') MEP_02_total = MEP_02.sum(dim='time') MEP_03_total = MEP_03.sum(dim='time') MEP_04_total = MEP_04.sum(dim='time') MEP_05_total = MEP_05.sum(dim='time') MEP_06_total = MEP_06.sum(dim='time') MEP_07_total = MEP_07.sum(dim='time') MEP_08_total = MEP_08.sum(dim='time') MEP_09_total = MEP_09.sum(dim='time') MEP_10_total = MEP_10.sum(dim='time') MEP_11_total = MEP_11.sum(dim='time') MEP_12_total = MEP_12.sum(dim='time') # Calculate AEP without losses AEP_total = (MEP_01_total + MEP_02_total + MEP_03_total + MEP_04_total + MEP_05_total + MEP_06_total + MEP_07_total + MEP_08_total + MEP_09_total + MEP_10_total + MEP_11_total + MEP_12_total) / (10**9) 3. I save the AEP as a geotiff: # Define output file path output_file_path = r"R:\...\AEP_total.tif" # Extract coordinates and pixel size lon = data['XLON'].values # Assuming XLON is the longitude coordinate lat = data['XLAT'].values # Assuming XLAT is the latitude coordinate west = lon.min() # Minimum longitude east = lon.max() # Maximum longitude north = lat.max() # Maximum latitude south = lat.min() # Minimum latitude # Calculate pixel size based on the shape of the data pixel_size_x = (east - west) / data.sizes['west_east'] pixel_size_y = (north - south) / data.sizes['south_north'] # Get the transform for the output raster transform = from_origin(west, north, pixel_size_x, pixel_size_y) # Squeeze AEP_total to remove extra dimensions AEP_total_squeezed = AEP_total.squeeze() # Save the AEP_total as a GeoTIFF with rasterio.open( output_file_path, 'w', driver='GTiff', height=AEP_total_squeezed.shape[0], width=AEP_total_squeezed.shape[1], count=1, dtype=AEP_total_squeezed.dtype, crs='EPSG:4326', # Set the CRS based on your requirements transform=transform ) as dst: dst.write(AEP_total_squeezed.values, 1) print(f"AEP_total saved to {output_file_path}.") 4. Import the .tif file into QGIS. Overall i tried several ways to get a correct projection, placement and size of my output data. In the end I need the AEP within EPSG:2157 for post-processing. For example I tired utilizing the windkit package, as well as warping the AEP file with gdal. However, I was not able to come up with a solution. The output was either located somewhere else in QGIS or was rotated and bigger. Where in my working process is the correct place to interfere and ensure that the data is processed in the correct way. Thanks a lot and best regards Lucas